
 menu
menu
The D2S2 user interface consists of several components:
each of which is explained in detail in this section of the documentation.
The default user interface at start-up will display a 3D visualisation screen with a toolbar along the top of the window, as shown in Figure 1.
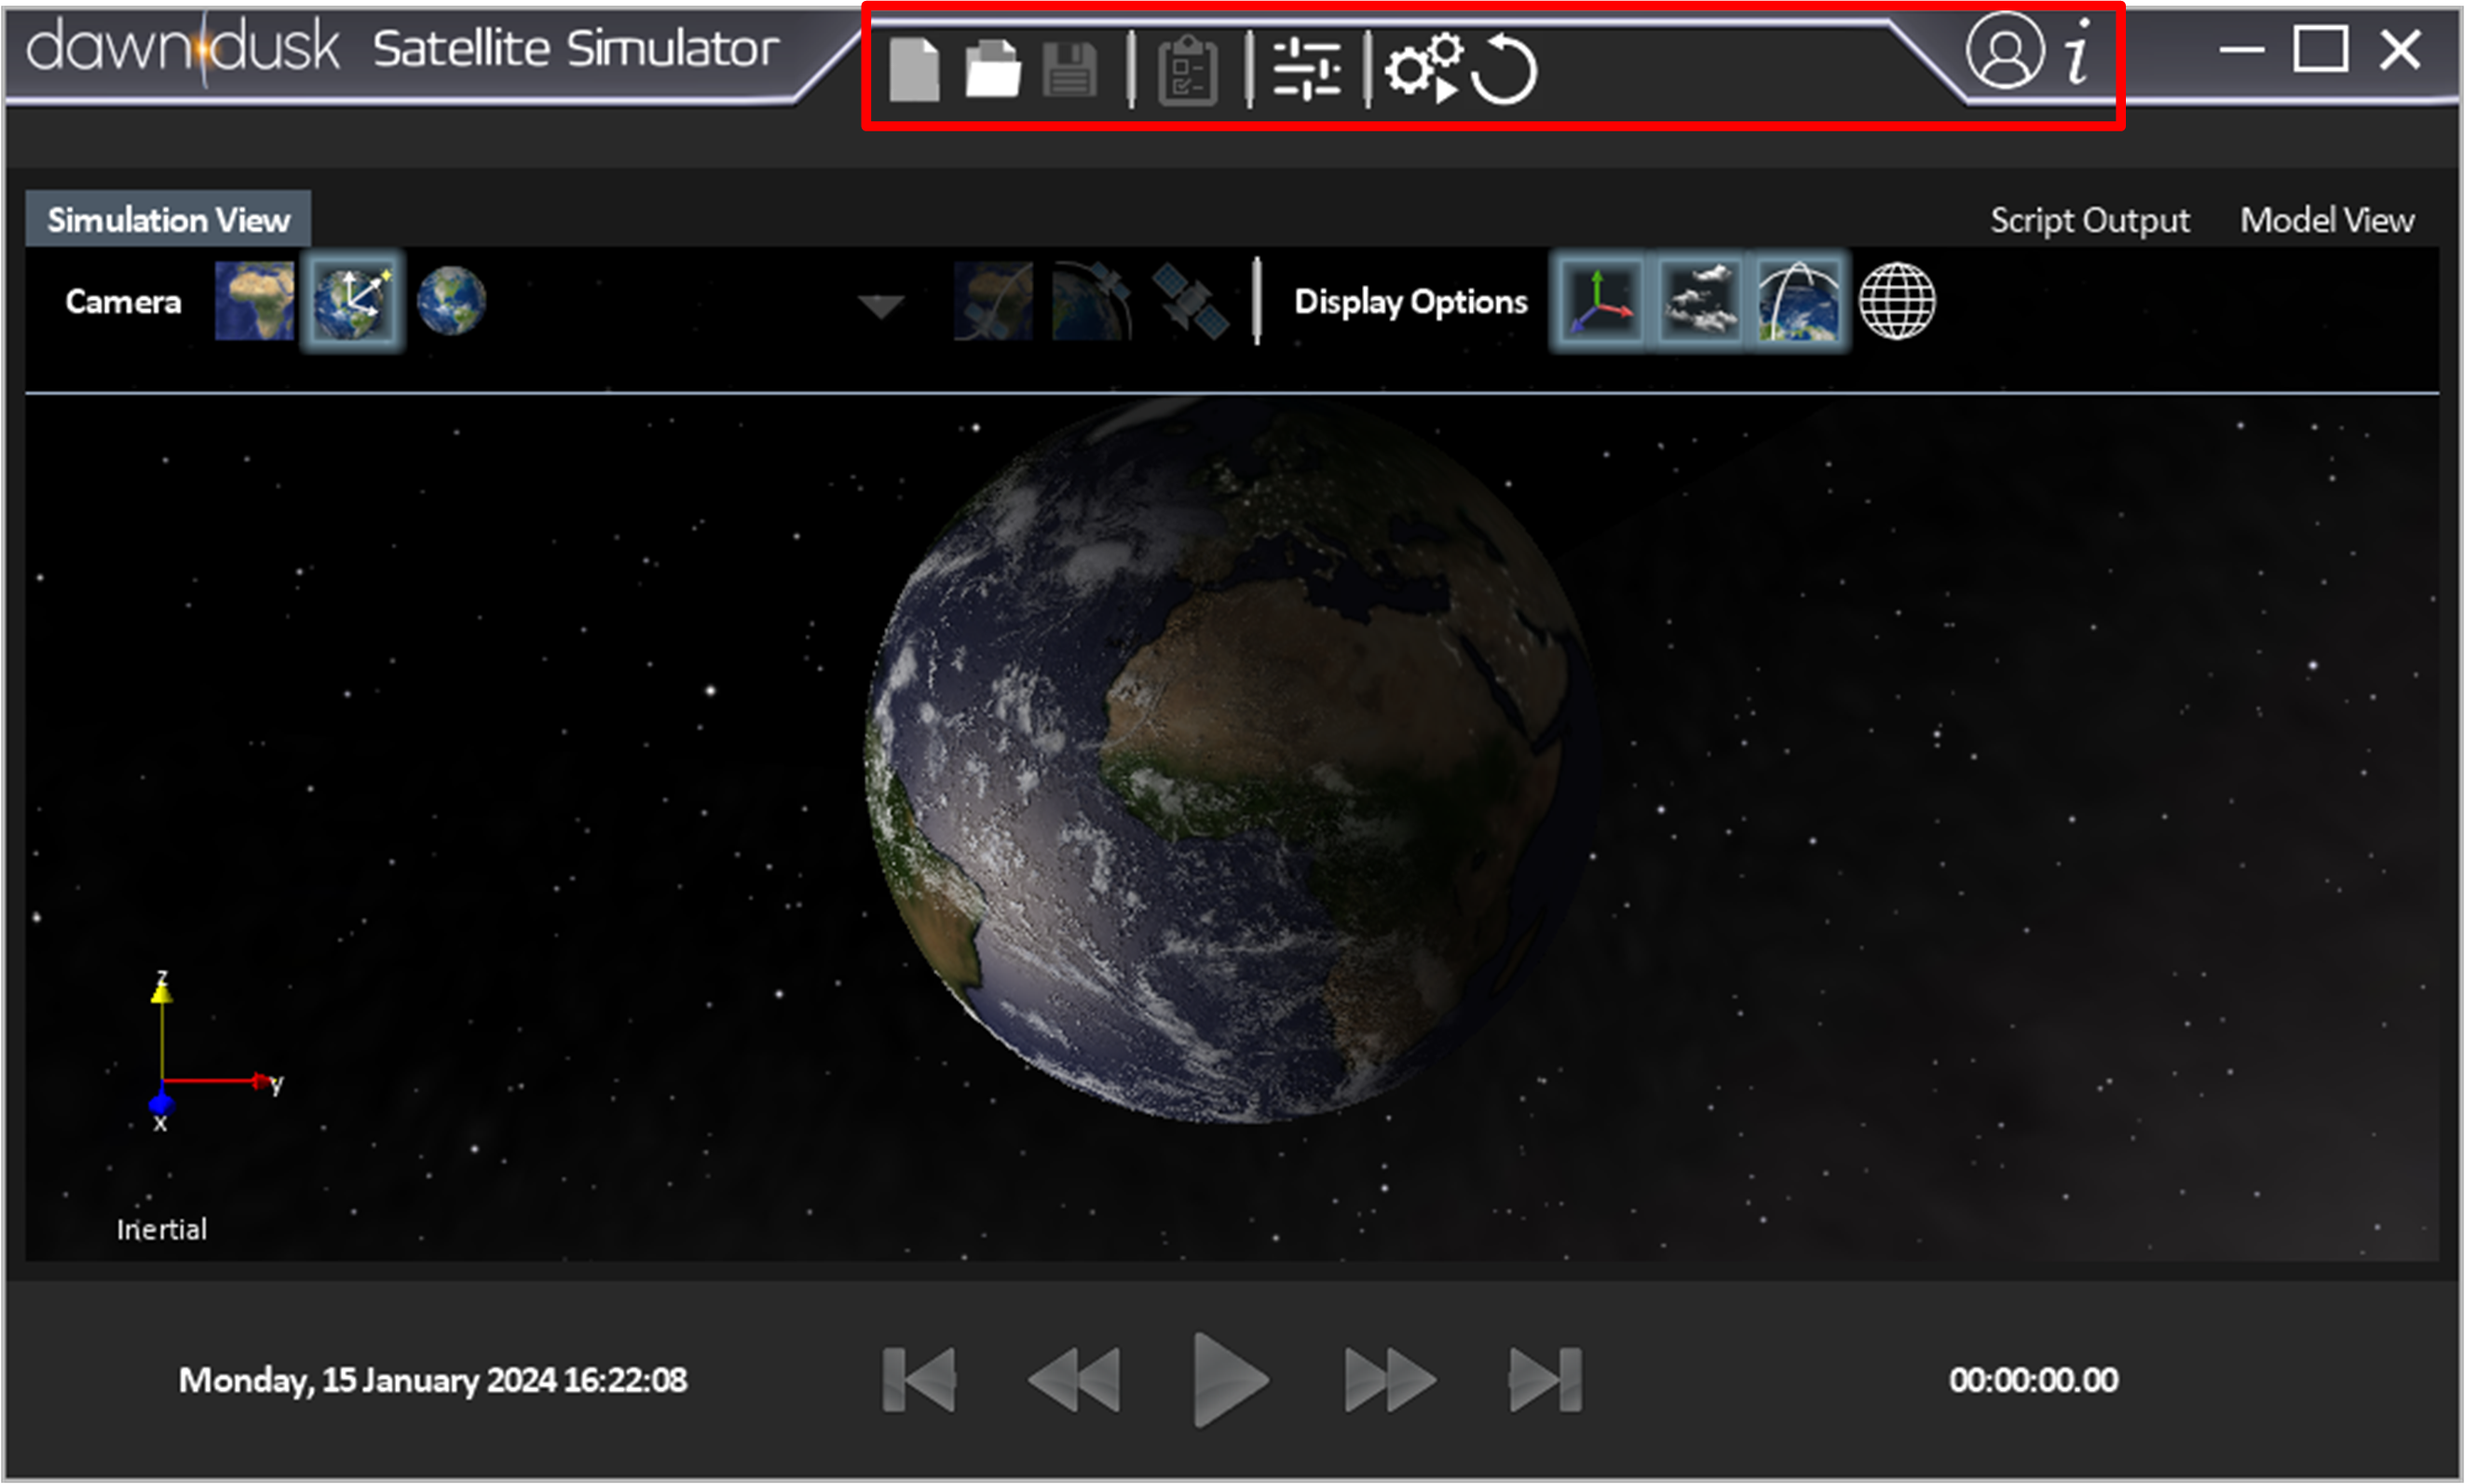 Figure 1: Start-up user interface. The red box indicates the toolbar buttons.
The toolbar buttons and their functions are tabulated below:
| Icon | Function | Description |
|---|---|---|
 |
New Scenario | Initialise a new scenario. Creating a new scenario will delete the current model and simulation progress. |
 |
Open Scenario | Load an existing scenario file. Pressing this button will cause a file window to appear, where the user can select a scenario file (D2S2 scenario files have a .d2s2 extension. Go here for more information about scenario files). |
 |
Save Scenario | Save the current scenario to a .d2s2 project file. The current model objects, their initial properties, dependencies between model objects, and the simulation settings are saved (Go here for more information about scenario files). |
 |
Run Script | Pressing this button will open a window from where available scripts are listed. |
 |
Simulation Options | Change the simulation options. Pressing this button will cause a window to appear from where simulation start time, duration and time step can be changed. See here this page for more information about the simulation settings. |
 |
Run Simulation | If the simulation is running, pressing this button will pause the simulation. If the simulation is paused or in reset, pressing this button will run the simulation. |
 |
Reset Simulation | Reset the simulation (this is necessary to create or modify model components). |
 |
Sign In | Opens a window that prompts you to enter your D2S2 username and password. Signing in is necessary to access all of D2S2's features. |
 |
About | Display version and license information. |
Table 1: The buttons on the top toolbar and their corresponding functions.
The Model View Window depicted in Figure 2 is accessed by clicking the ![]() button.
It shows how the scenario is constructed by displaying the dependencies between model objects as an object graph.
The base of the object graph is the simulation model, which is dependent on models of the earth, sun moon, one or more satellites, as well as a number of geographic locations.
In turn, these models have their own dependencies.
As an example, the earth model is dependent on models of the atmosphere, magnetic field, ionosphere and central body gravitational potential.
button.
It shows how the scenario is constructed by displaying the dependencies between model objects as an object graph.
The base of the object graph is the simulation model, which is dependent on models of the earth, sun moon, one or more satellites, as well as a number of geographic locations.
In turn, these models have their own dependencies.
As an example, the earth model is dependent on models of the atmosphere, magnetic field, ionosphere and central body gravitational potential.
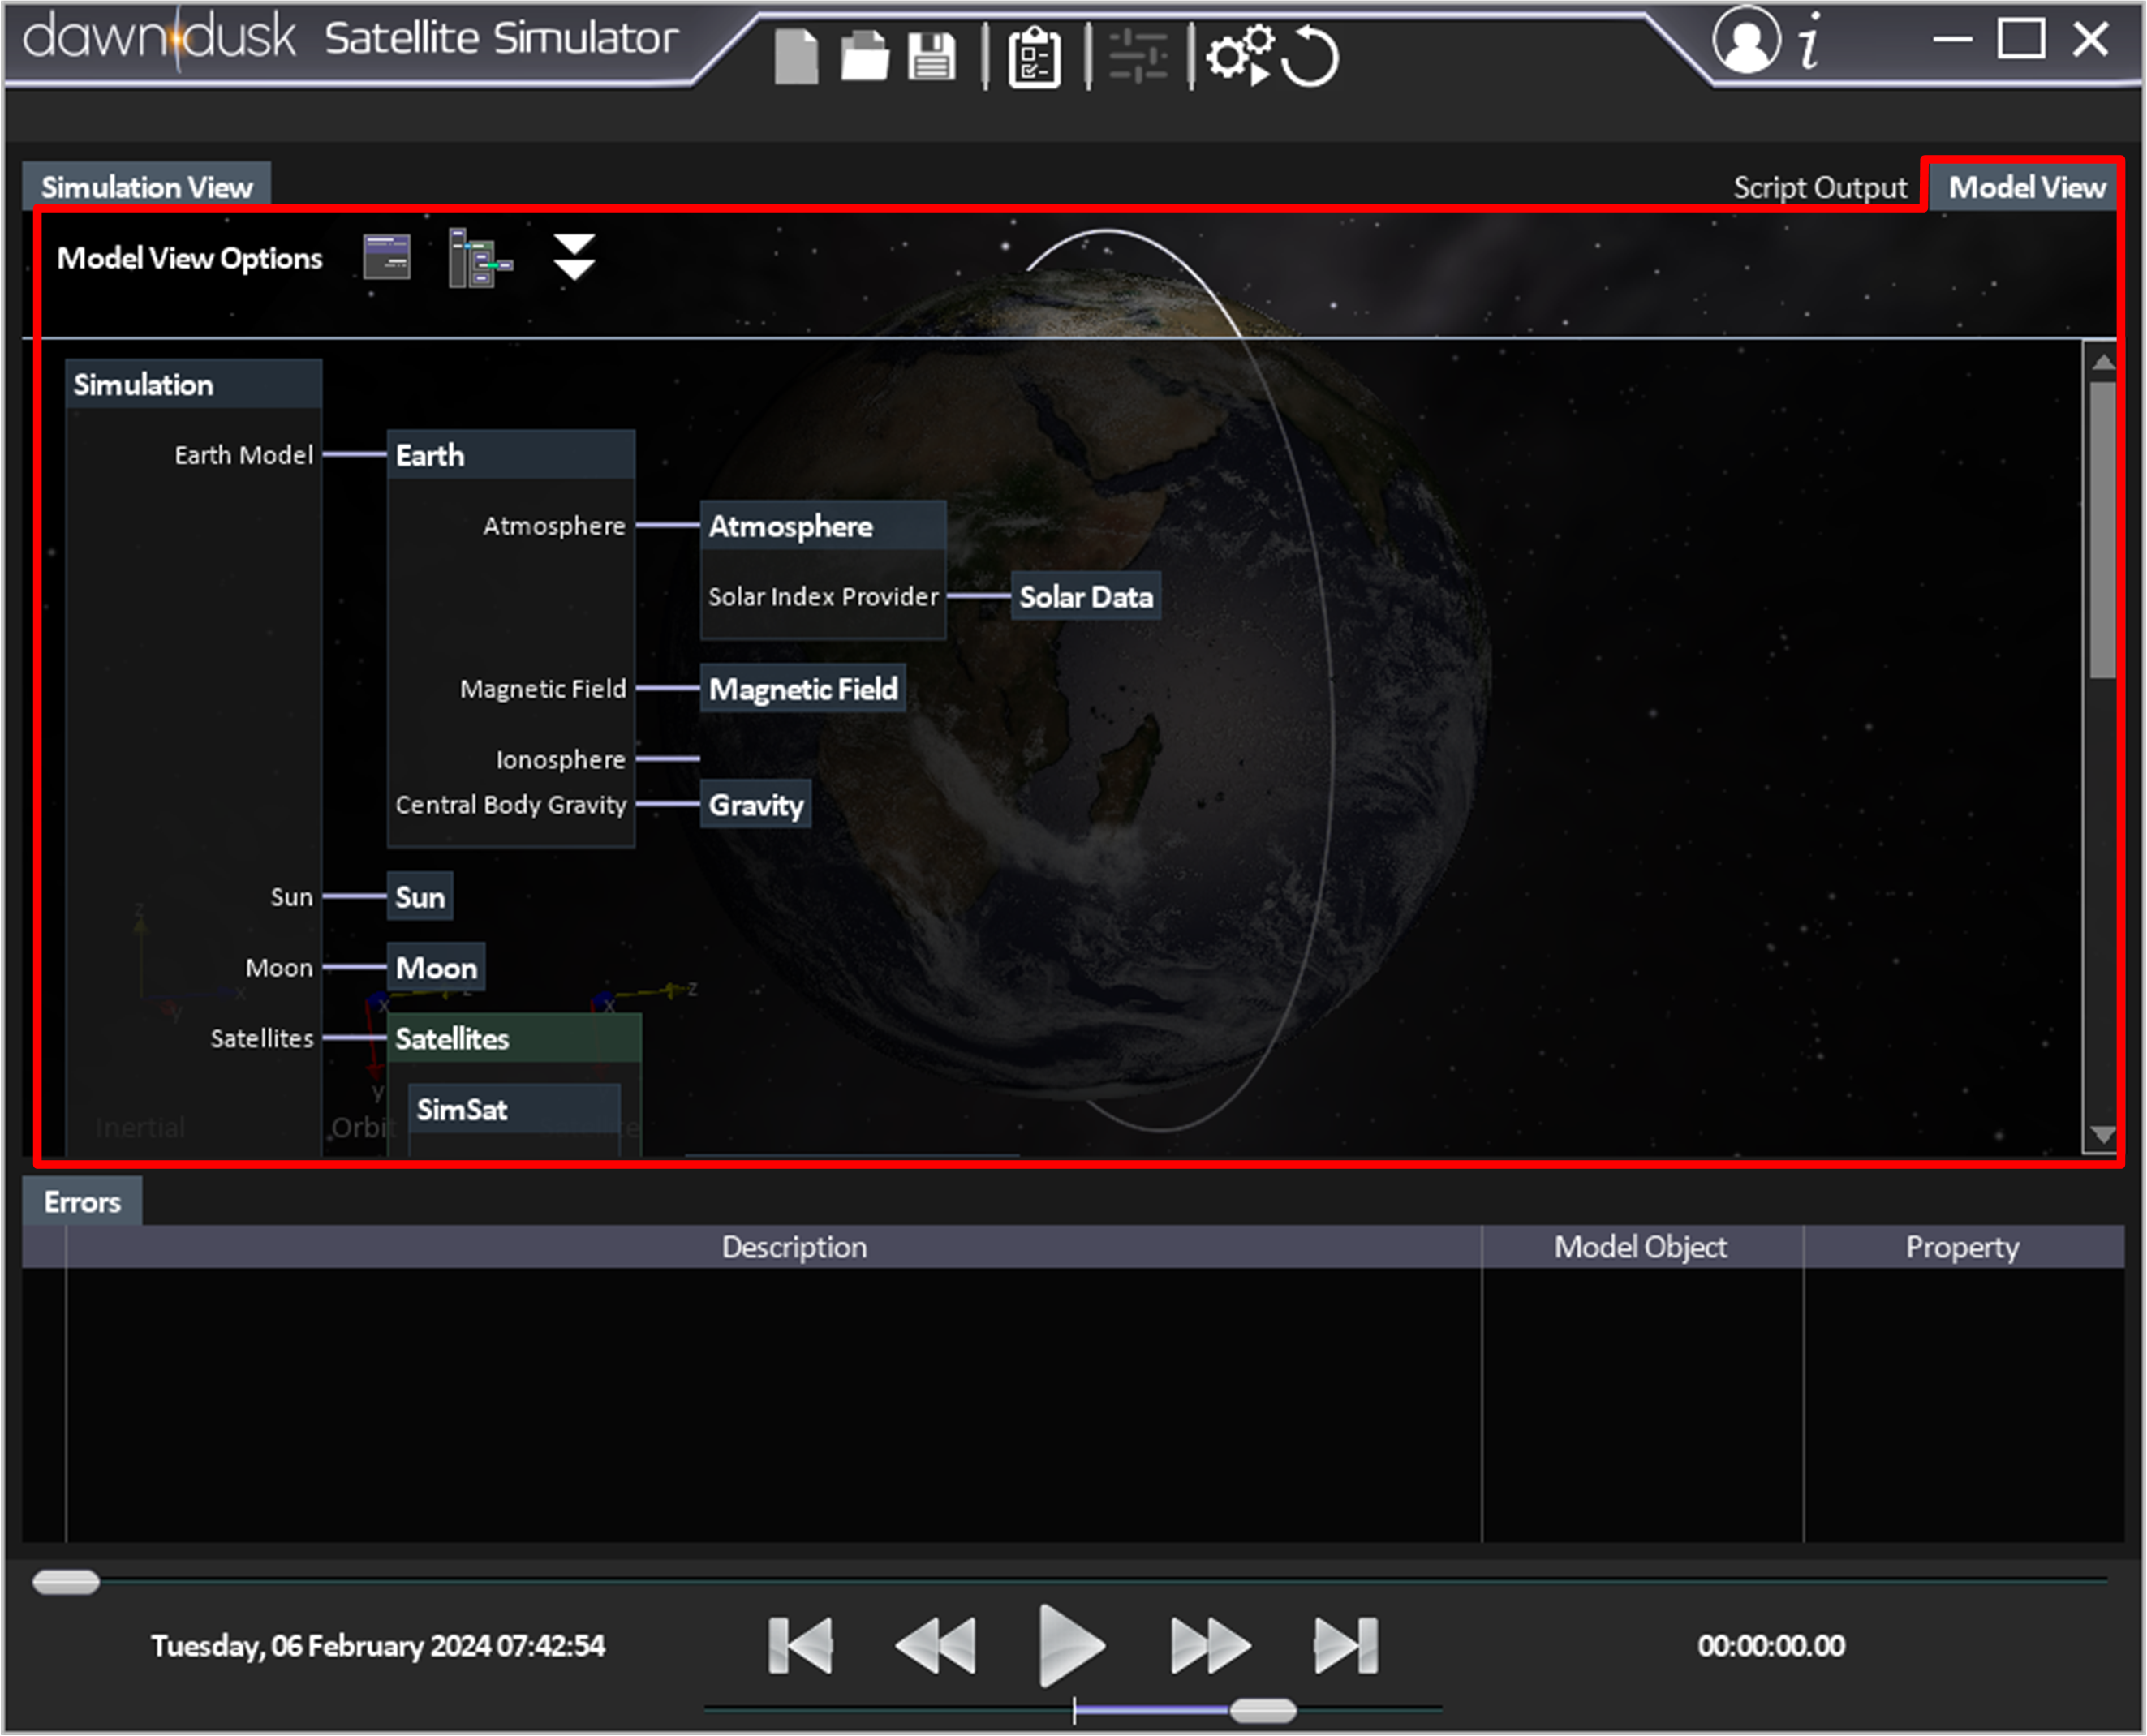 Figure 2: The model view Window (as indicated by the red box) shows the dependencies between model objects as a graph.
The simulation view, shown in Figure 3, is a visual representation of the simulation results.
Through this view, you can observe an animation of the satellite orbiting the Earth both during and after the simulation run.
It is accessed by pressing the ![]() button.
button.
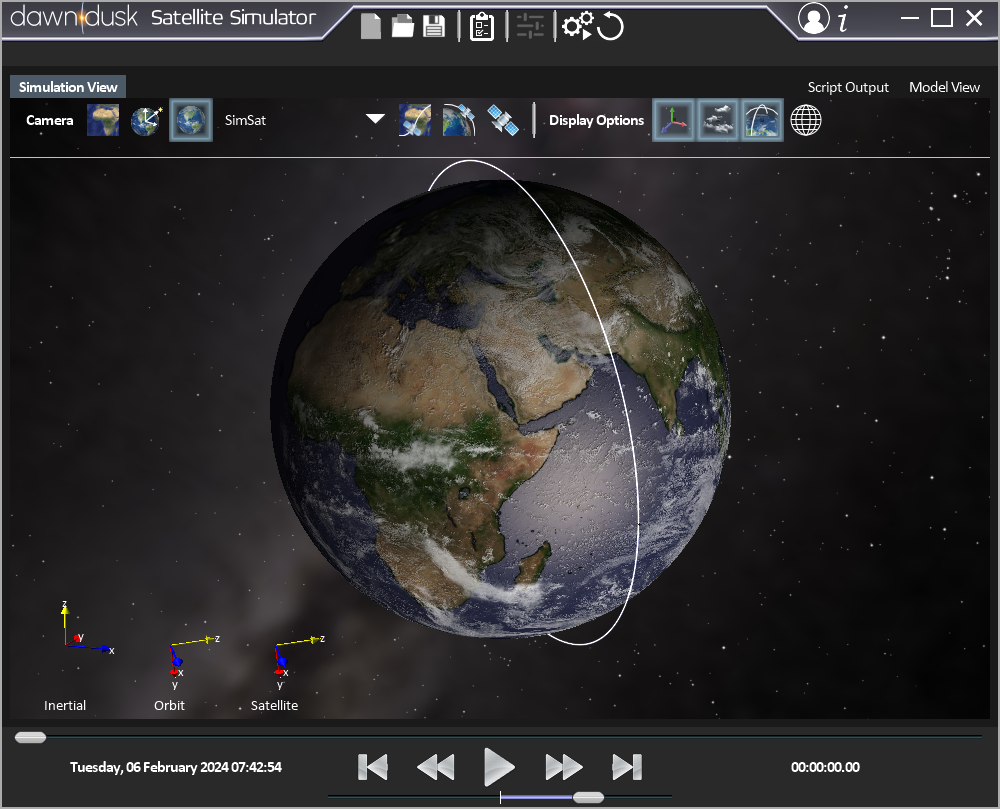 Figure 3: The simulation view shows an animation of the satellite orbiting the Earth.
Several camera views are available for observing the satellite using through this view. They are tabulated below:
| Icon | View Name | Description |
|---|---|---|
| Map View 2D Camera | The camera is fixed to and shows the Earth as a flat map | |
| Inertial Camera | The camera is fixed to the Earth, but does not rotate with it. | |
| Earth Camera | The camera is fixed to and rotates with the Earth. | |
| Map View Following 2D Camera | Similar to Map View 2D Camera, except the camera is fixed to the satellite. | |
| Orbit Camera | The camera is fixed to the orbital reference frame. | |
| Satellite Camera | The camera is fixed to and rotates with the satellite. |
For a more detailed description about reference frames and the available views, see this page.
The input parameters and state of any model object can be viewed by selecting it. There are two methods to select an object. These are;
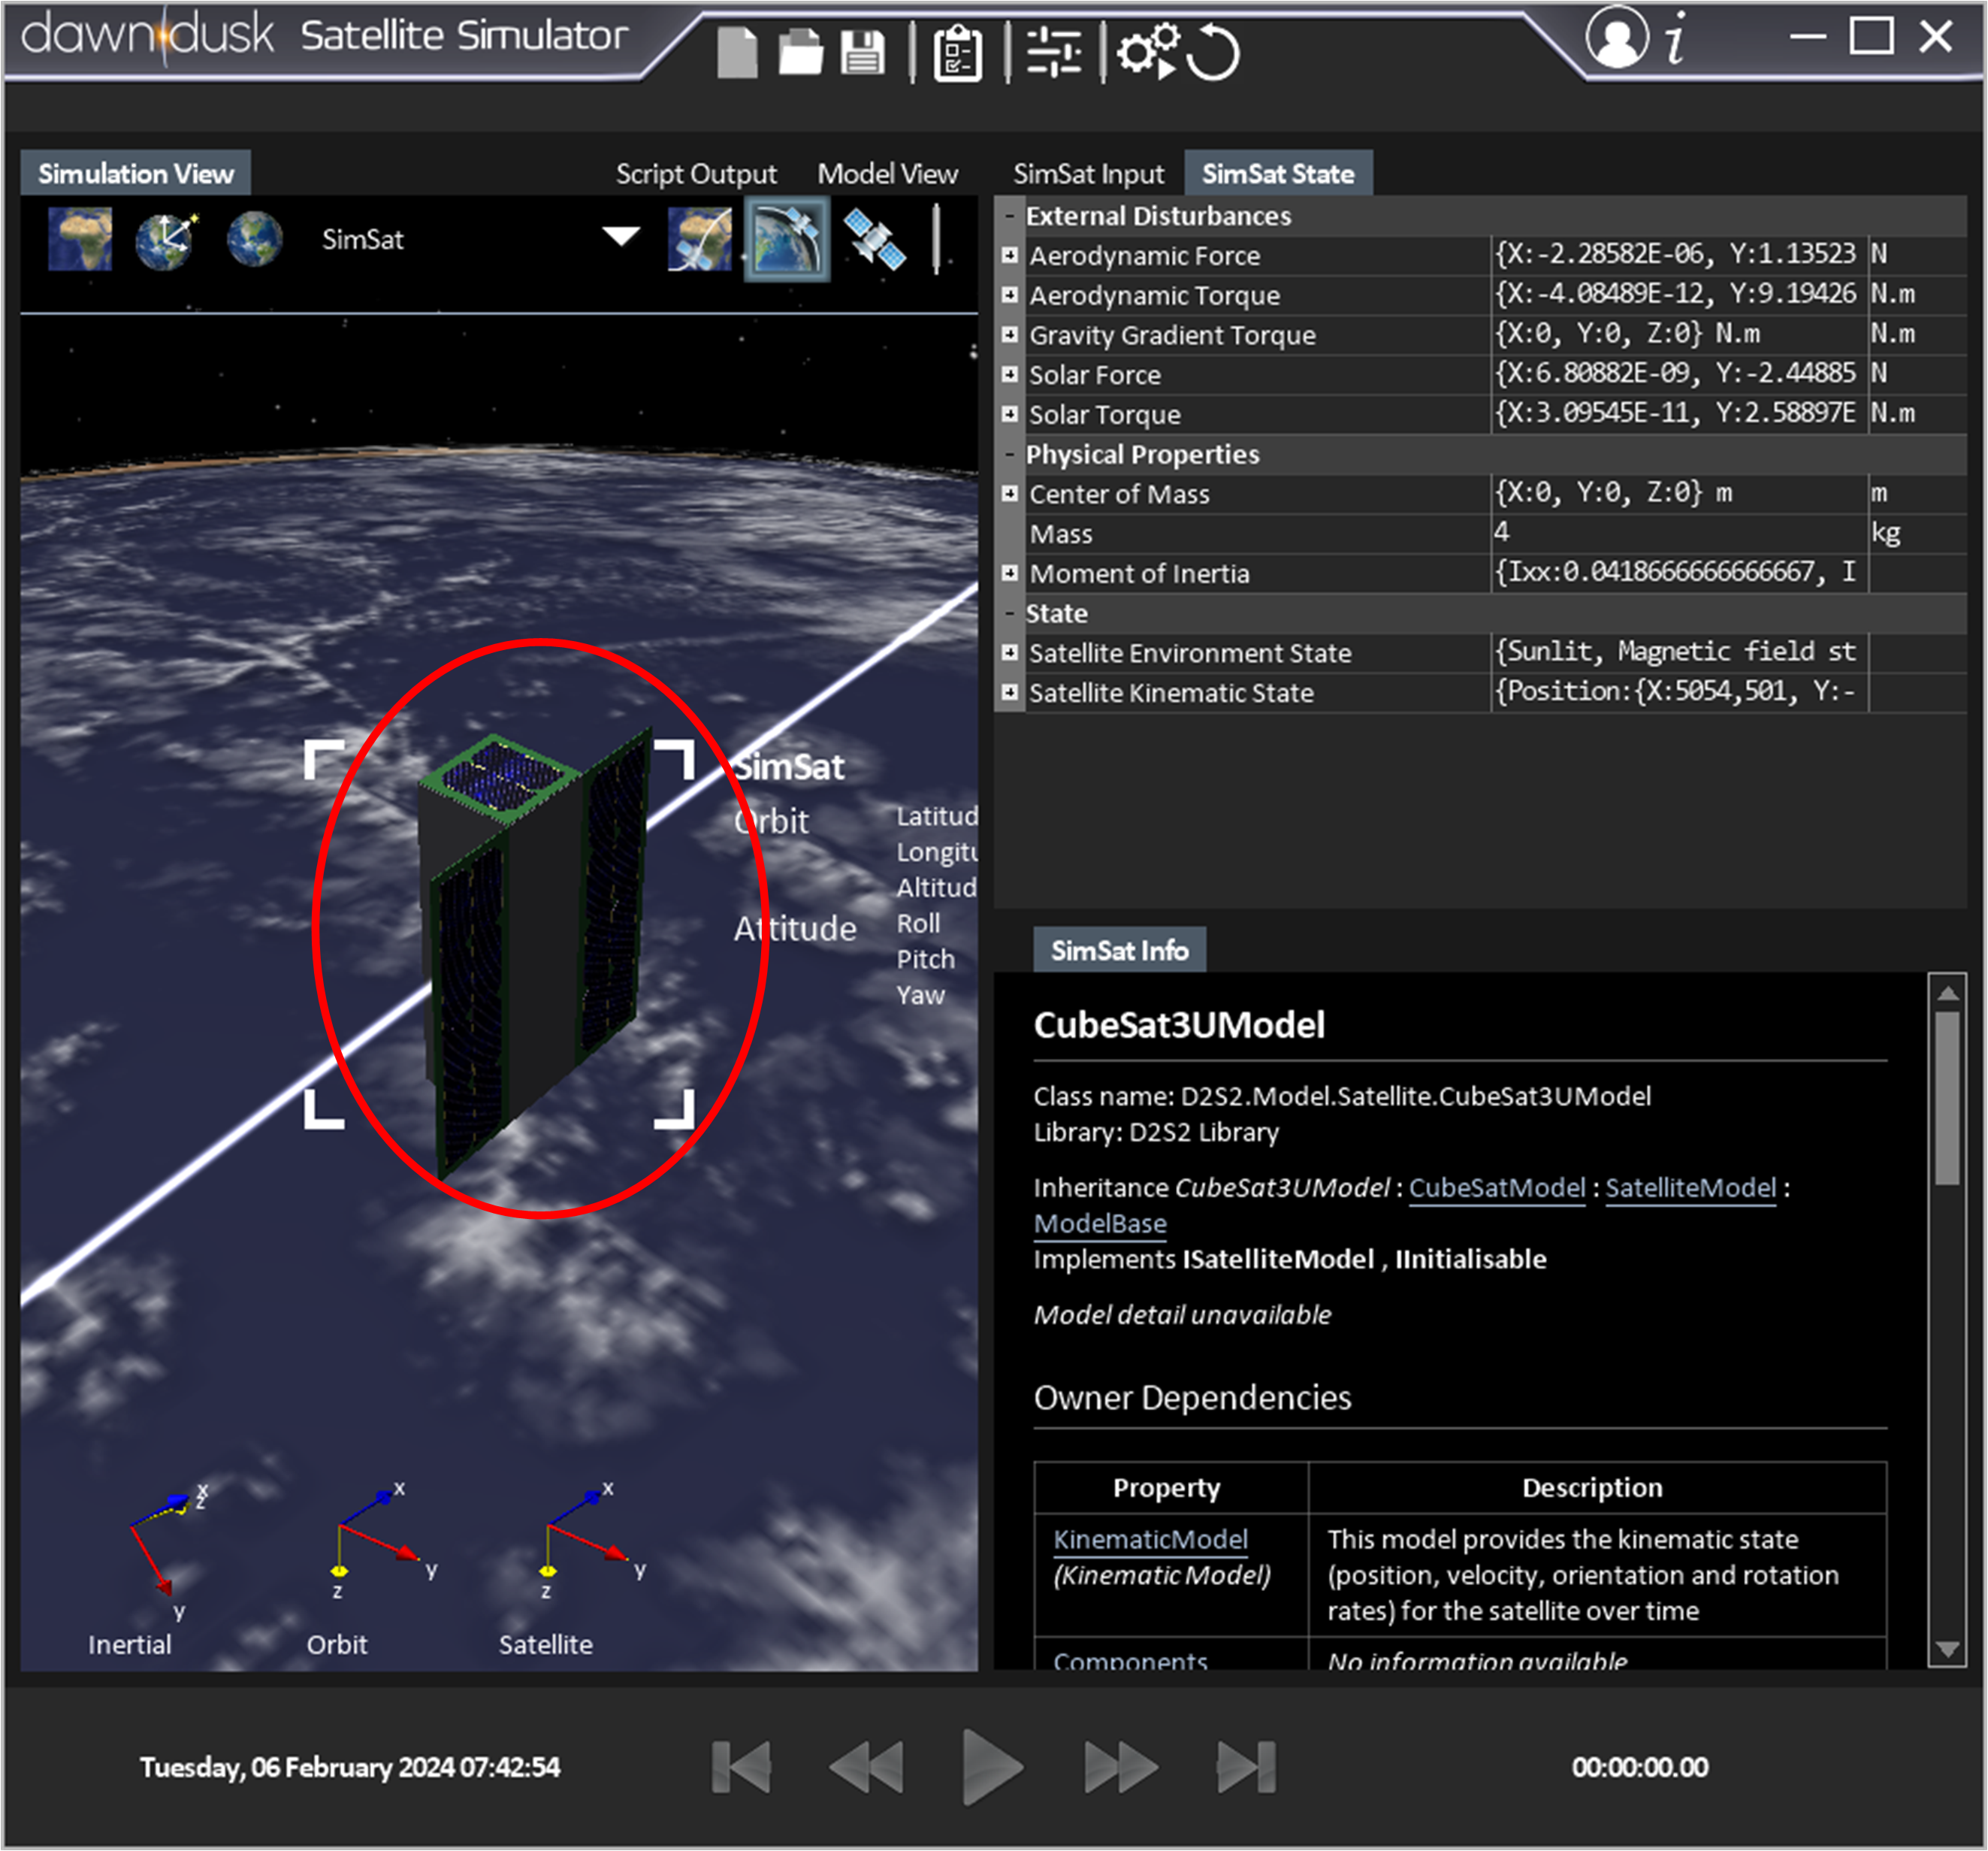
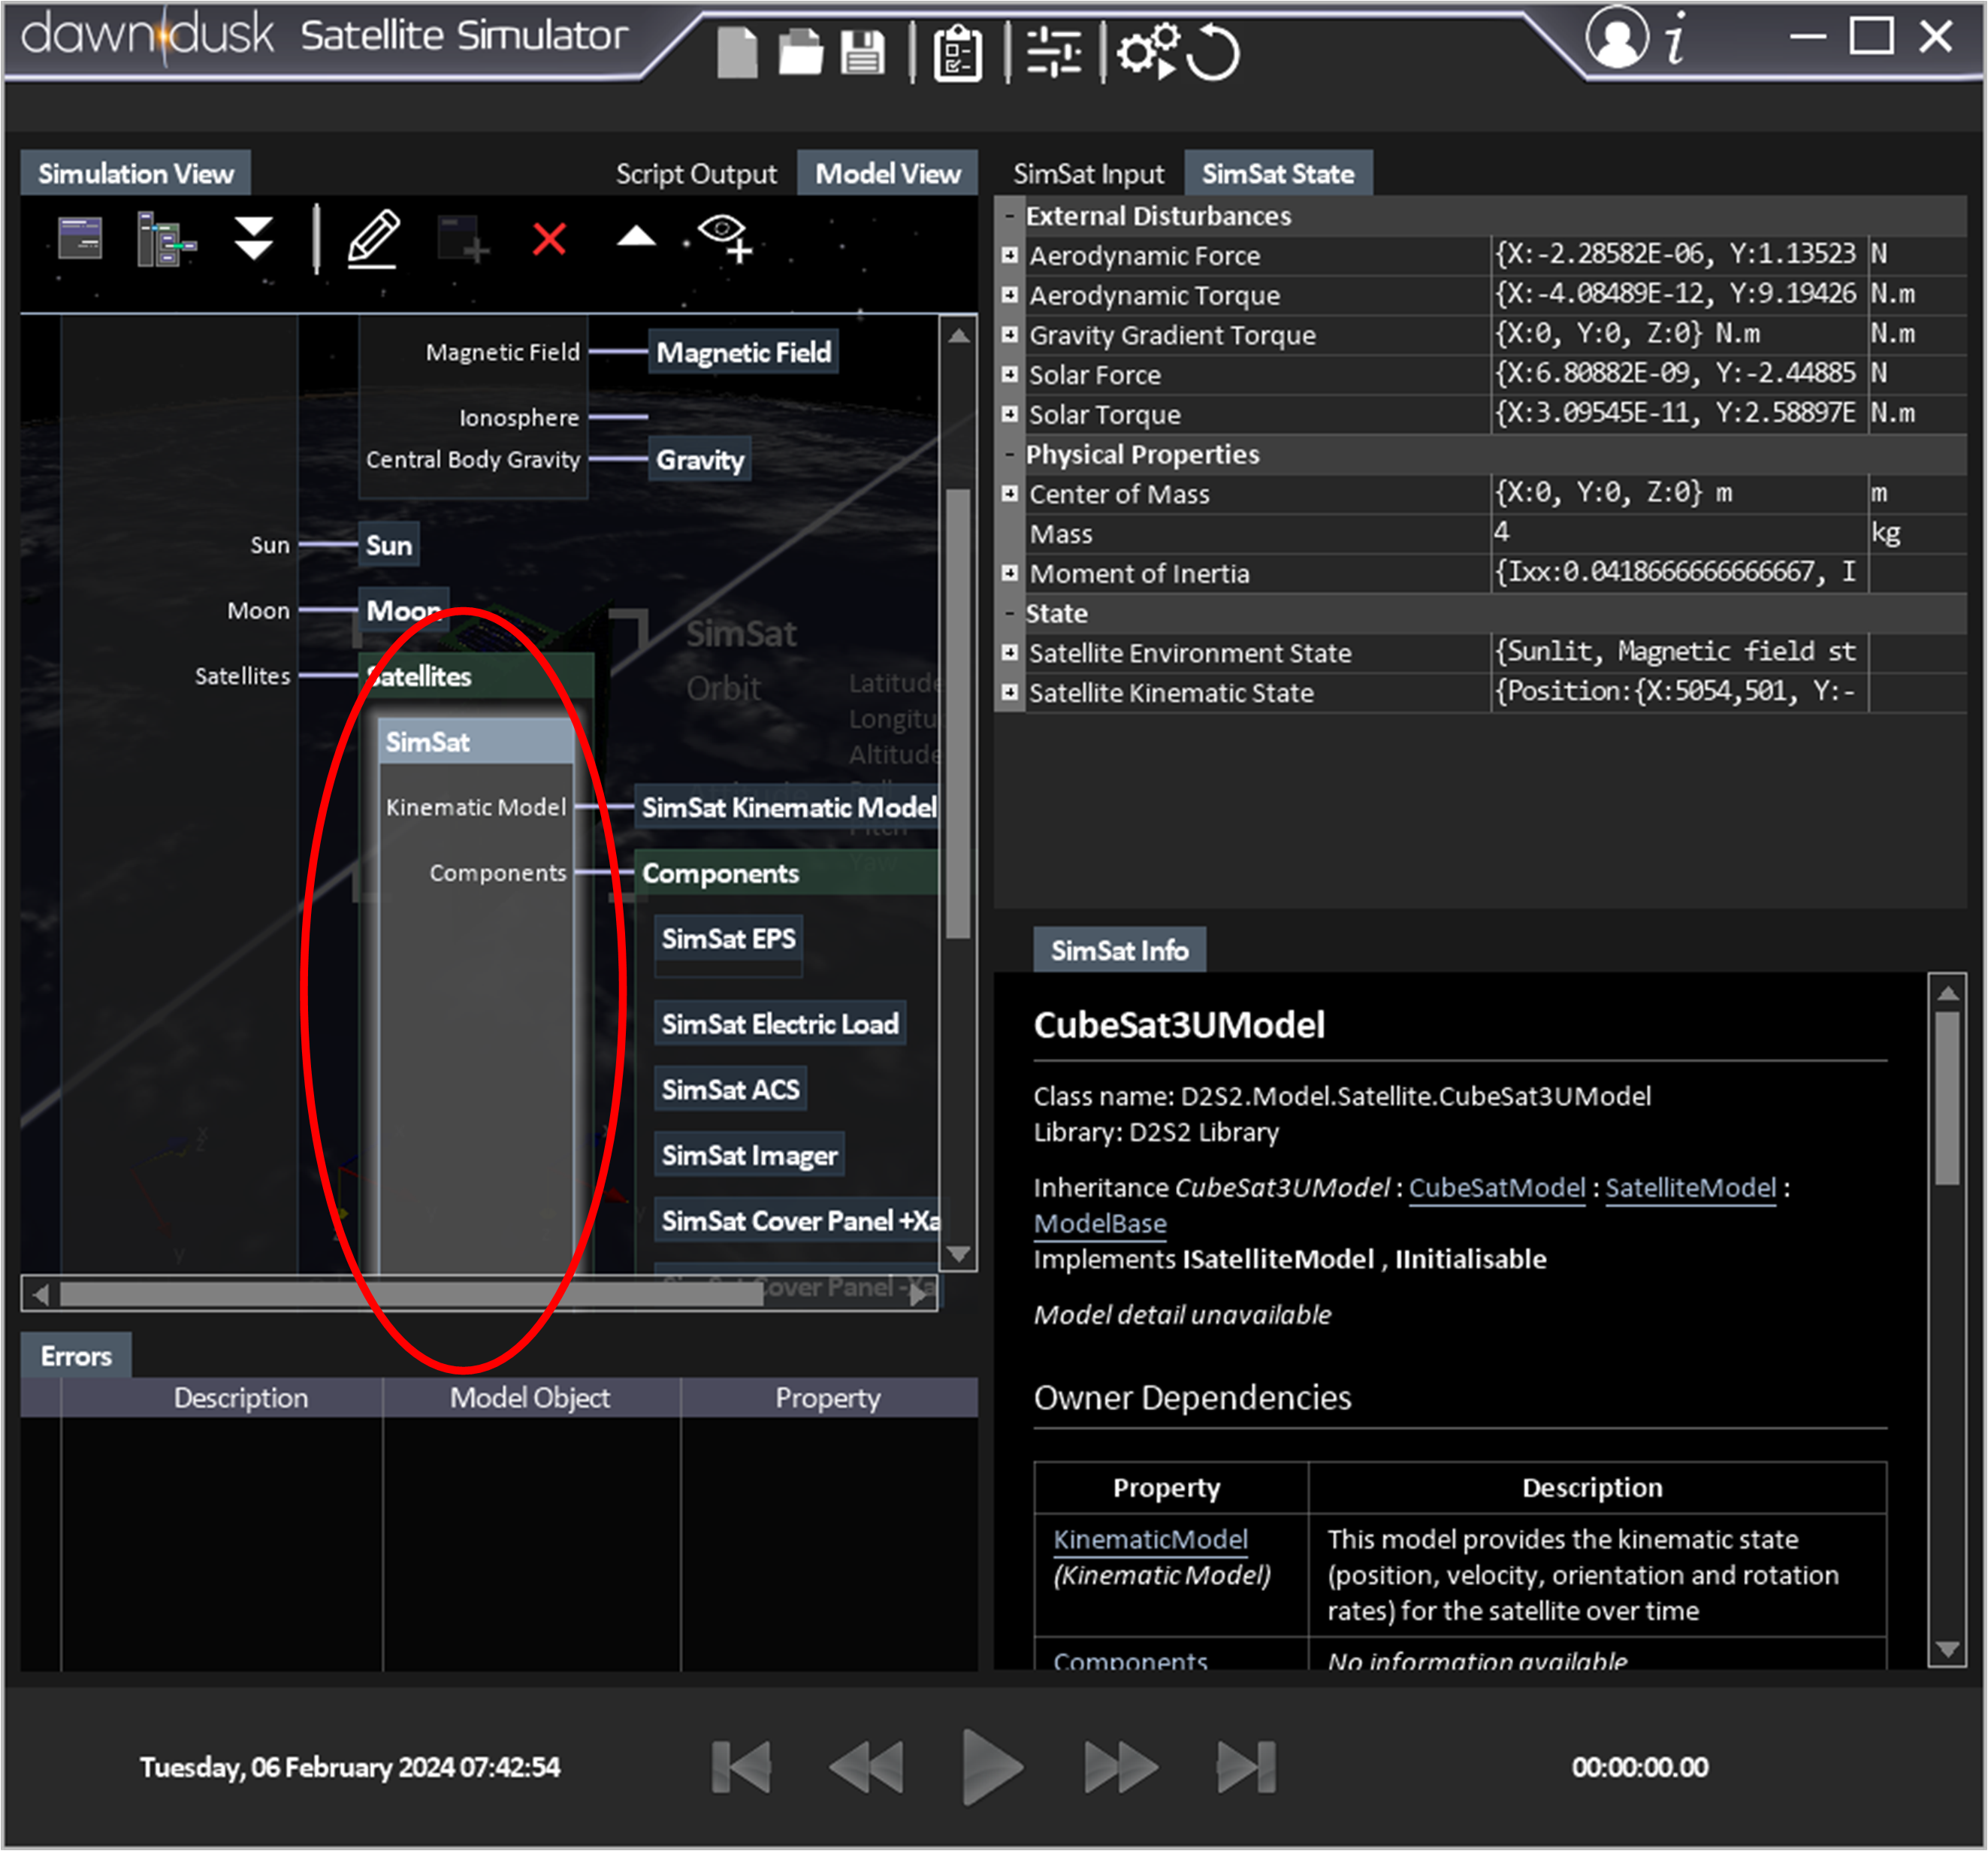 Figure 4: Screen capture corresponding showing the two methods to select a model object. These are via the simulation view (shown top), and the simulation model tree (shown bottom).
Once a model object is selected, its input parameters and initial state values can be altered through the Input panel.
Importantly, the model object initial values may only be altered while the simulation is paused or in the Reset ![]() state.
Otherwise, the initial values will be greyed out.
However, some model object properties may be altered after the start of the simulation.
Figure 4 shows an example input panel for the selected SimSat model object after pausing the simulation.
From this figure, nominal Alignment is greyed out, indicating that it is an initial parameter and cannot be changed.
However, the input parameters Include aero disturbances and Include solar disturbances can still be changed.
state.
Otherwise, the initial values will be greyed out.
However, some model object properties may be altered after the start of the simulation.
Figure 4 shows an example input panel for the selected SimSat model object after pausing the simulation.
From this figure, nominal Alignment is greyed out, indicating that it is an initial parameter and cannot be changed.
However, the input parameters Include aero disturbances and Include solar disturbances can still be changed.
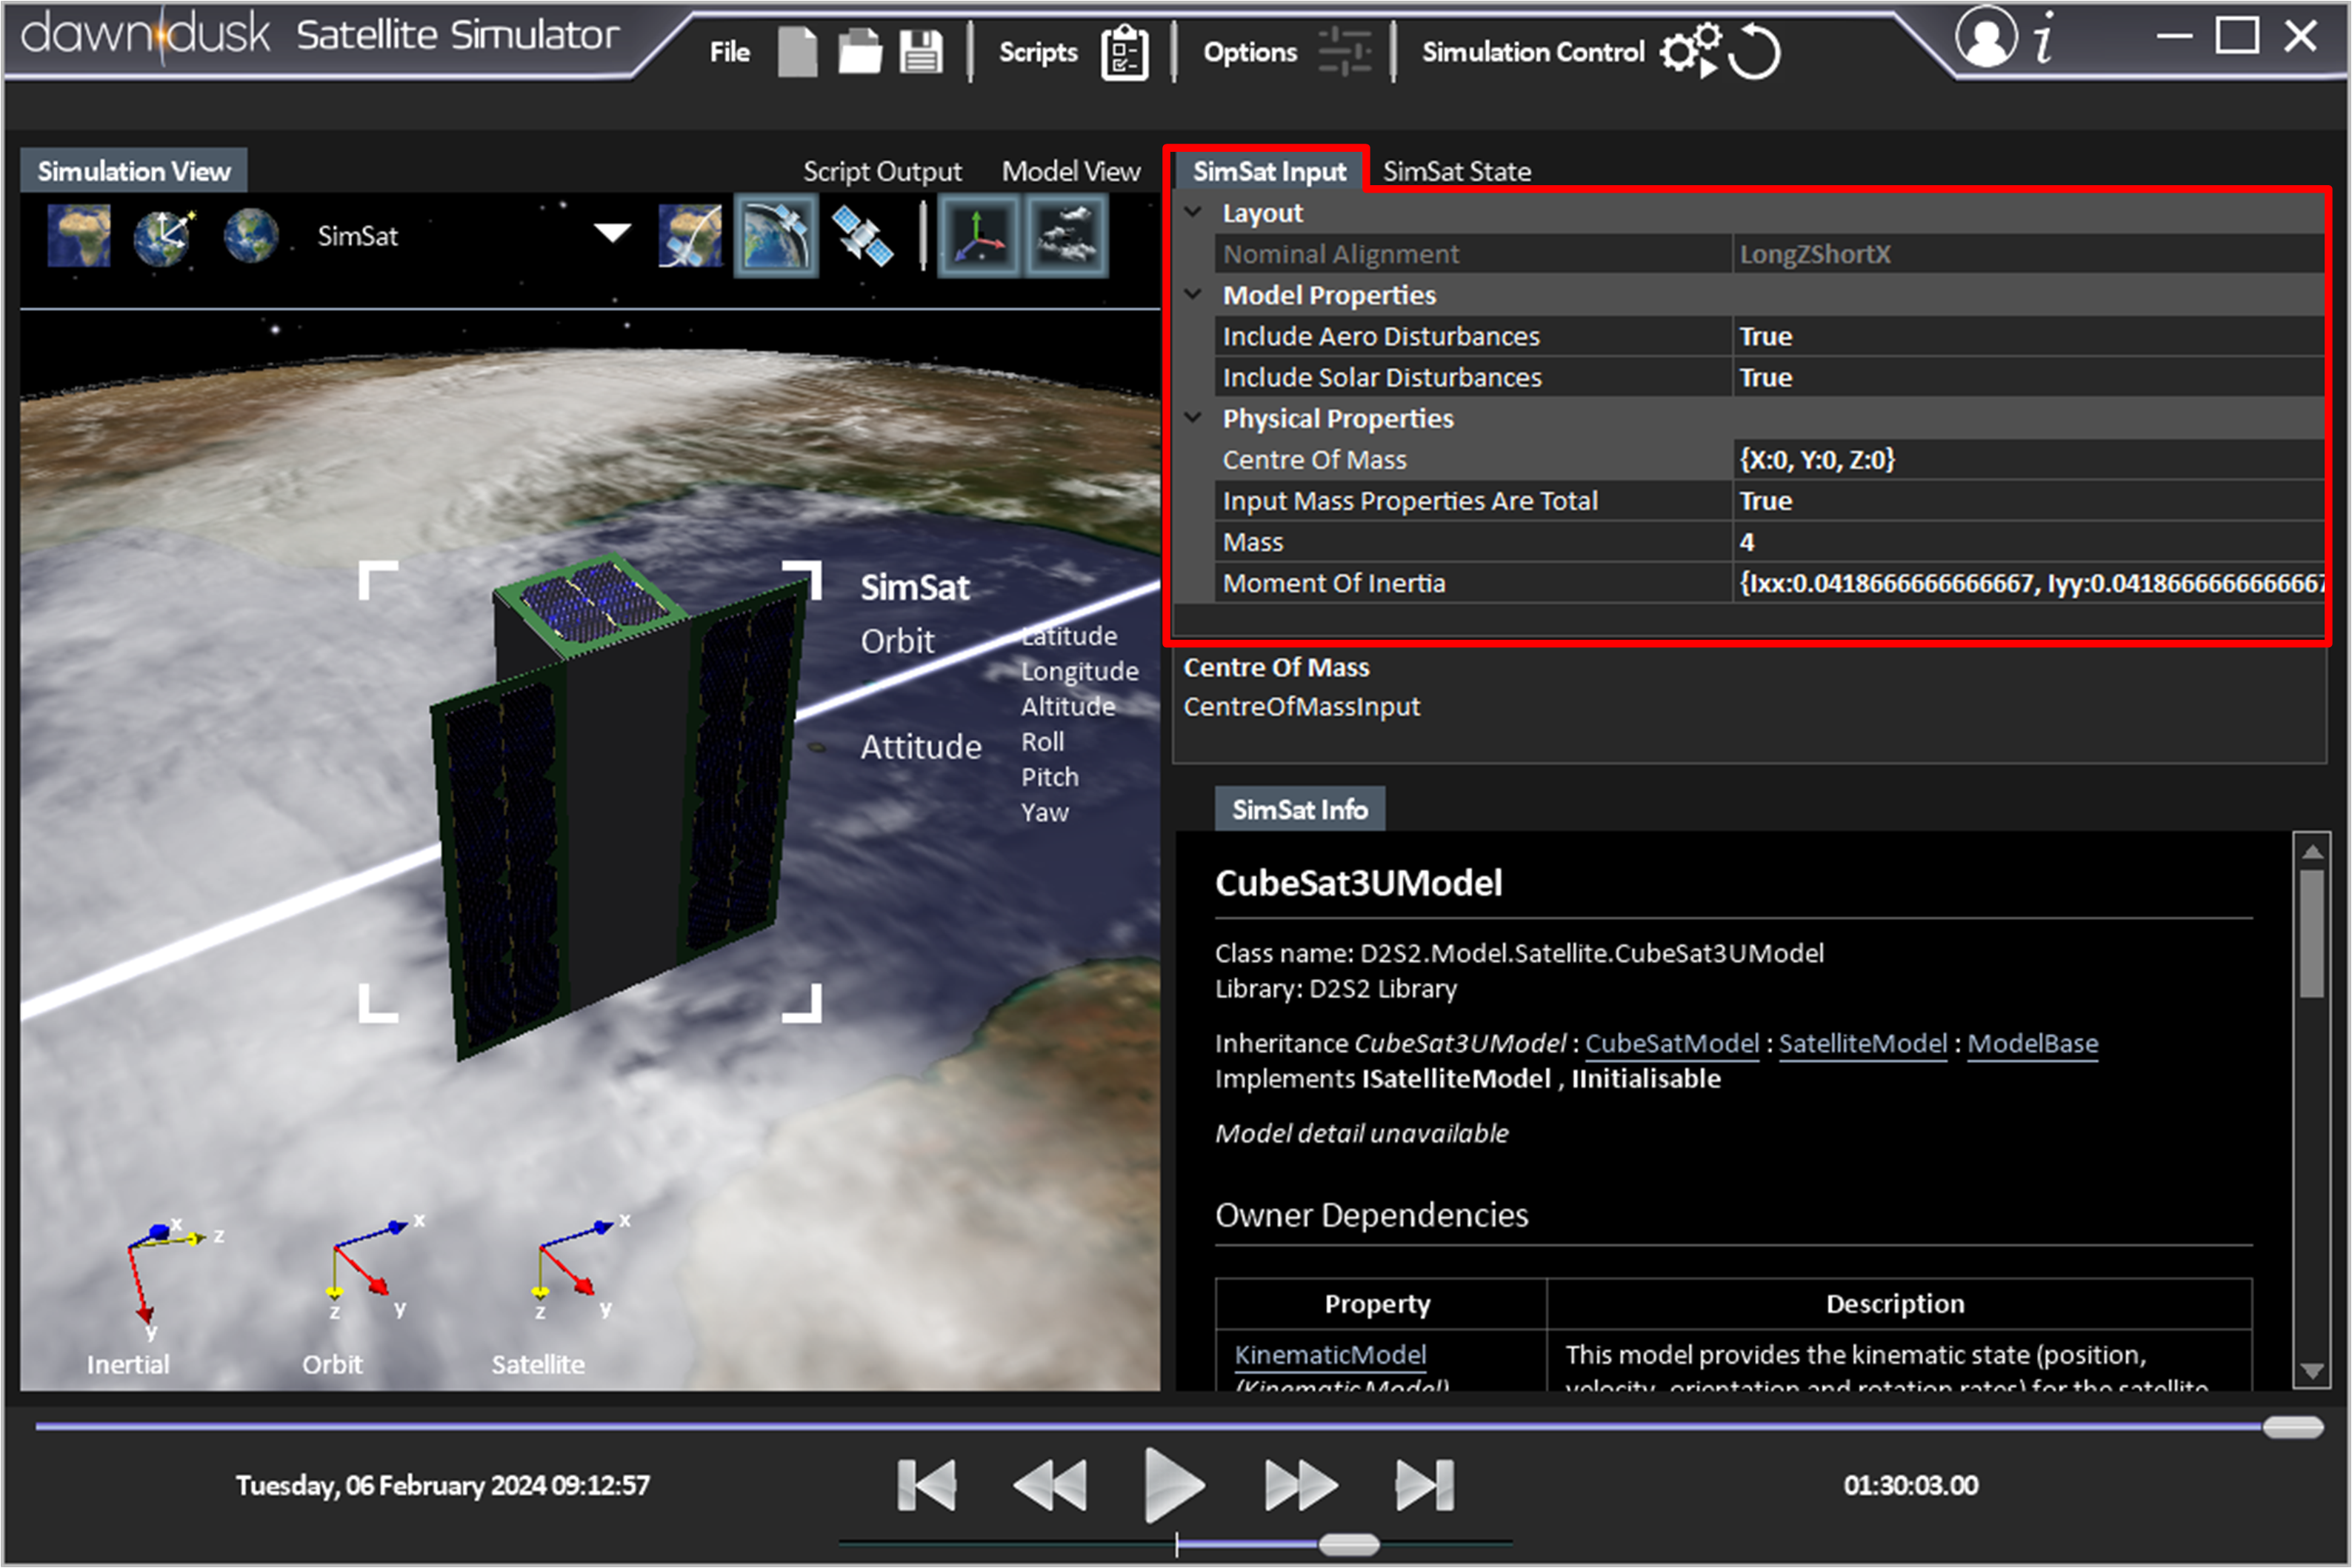 Figure 5: the input panel for the selected SimSat model object, after pausing the simulation.
The state panel shown in Figure 6 will display the recorded state of the selected model object for the current playback epoch. The state is listed as a number of properties, some which can be expanded with further child properties. If the simulation is in Reset, the initial state will be displayed.
Selecting a property in the state panel causes a plot of that property over time to be displayed in a Plot panel.
This plot appears directly beneath the state panel.
Figure 6 shows an example where the satellite's position has been selected from the state panel, and the x, y and z coordinates of the satellite are being plotted.
Furthermore, a number of buttons become visible when hovering over the plot window.
Notably, the ![]() button allows the data in the chart to be exported to a CSV file.
button allows the data in the chart to be exported to a CSV file.
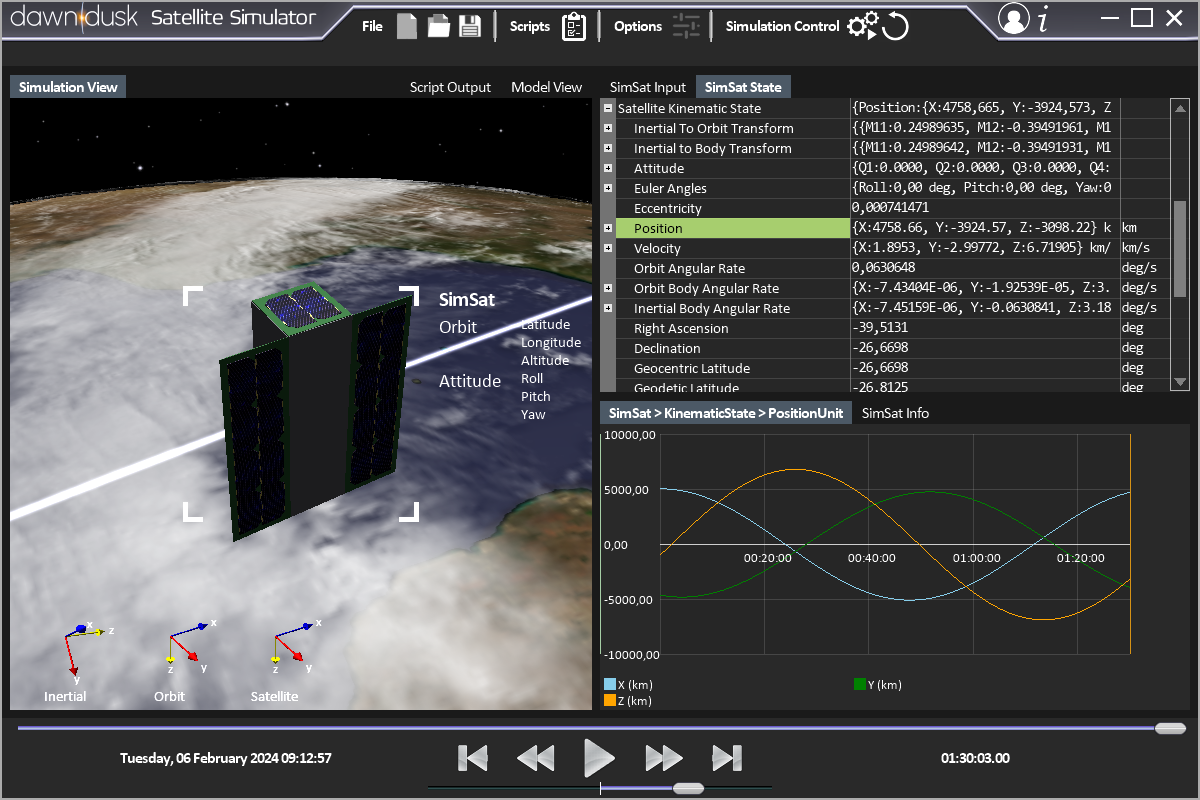 Figure 6: The Plot panel appears directly beneath the state panel. In this case, it is displaying the satellites position over time.
Whenever a model object is selected, but no input or state is selected, then an information panel will appear in the bottom right of the screen, in place of the plot panel. This information panel shows link dependencies between objects, initial value properties, as well as state properties. An example of this information panel displaying information for the SimSat EPS model object is shown in Figure 7.
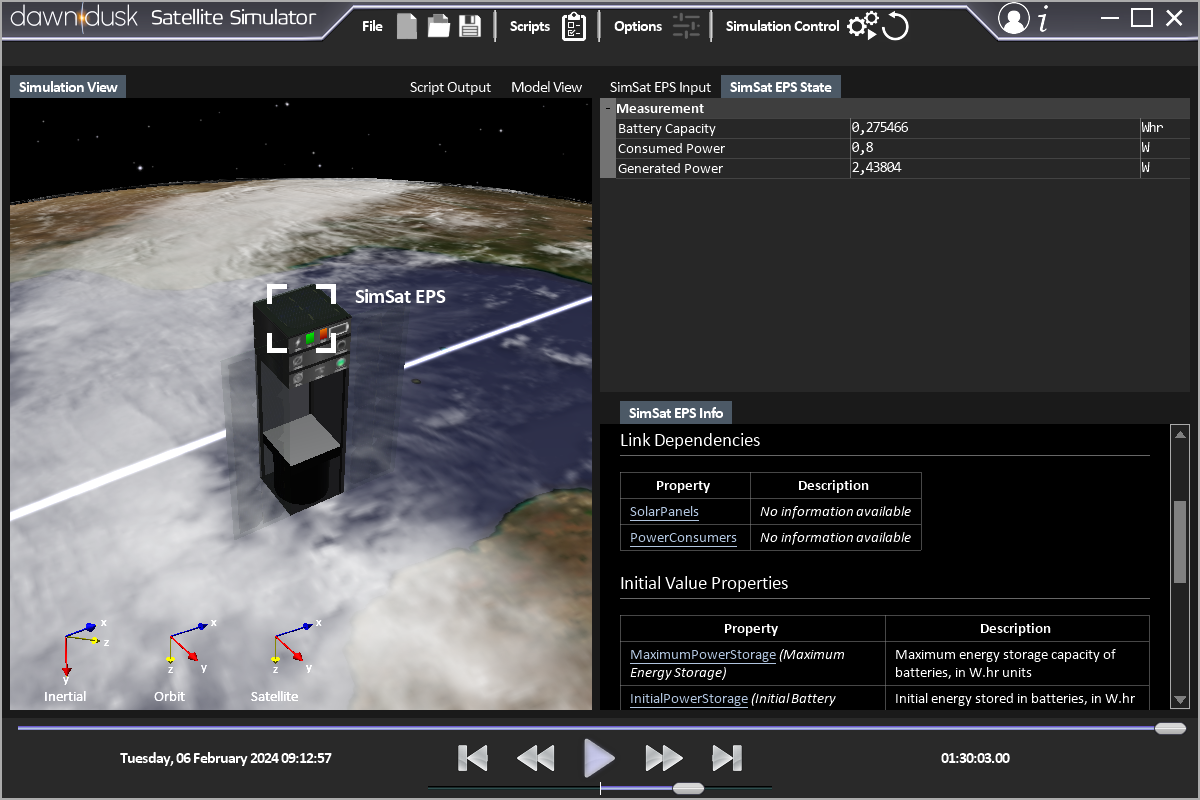 Figure 7: The information panel displaying link dependencies and initial value properties for the SimSat EPS.
As the simulation runs, the state for the model objects will be recorded and stored in a cache (go here to find more information about the settings that control the simulation and cache storage).
This state can be used to play back the simulation up to the point where the simulation was paused (Pressing the Reset Simulation button ![]() will also clear the cache).
The playback toolbar shown in Figure 8 can be used to play back the simulation stored in the cache.
Furthermore, the time slider the playback time to a specific point of interest.
will also clear the cache).
The playback toolbar shown in Figure 8 can be used to play back the simulation stored in the cache.
Furthermore, the time slider the playback time to a specific point of interest.
 Figure 8: The playback toolbar with buttons annotated.